GameDay View is a reporting dashboard dedicated to providing high-level business intelligence and insights on your organisation's membership and transactional data.
Using high-level summary data and visual insights, GameDay View is designed to give you a quick snapshot of certain metrics within your data set in a format that is perfect for presentations or board reports.
Note: GameDay View is currently not available to all customers. If you do not have access to GameDay View within your Passport database, please contact GameDay directly through the enquiry form here.
Accessing GameDay View
To access this from your Passport database, click GameDay View on the left-hand menu, then select GAMEDAY VIEW - INSIGHTS

Current reports available in GameDay View include:
KPI Insights
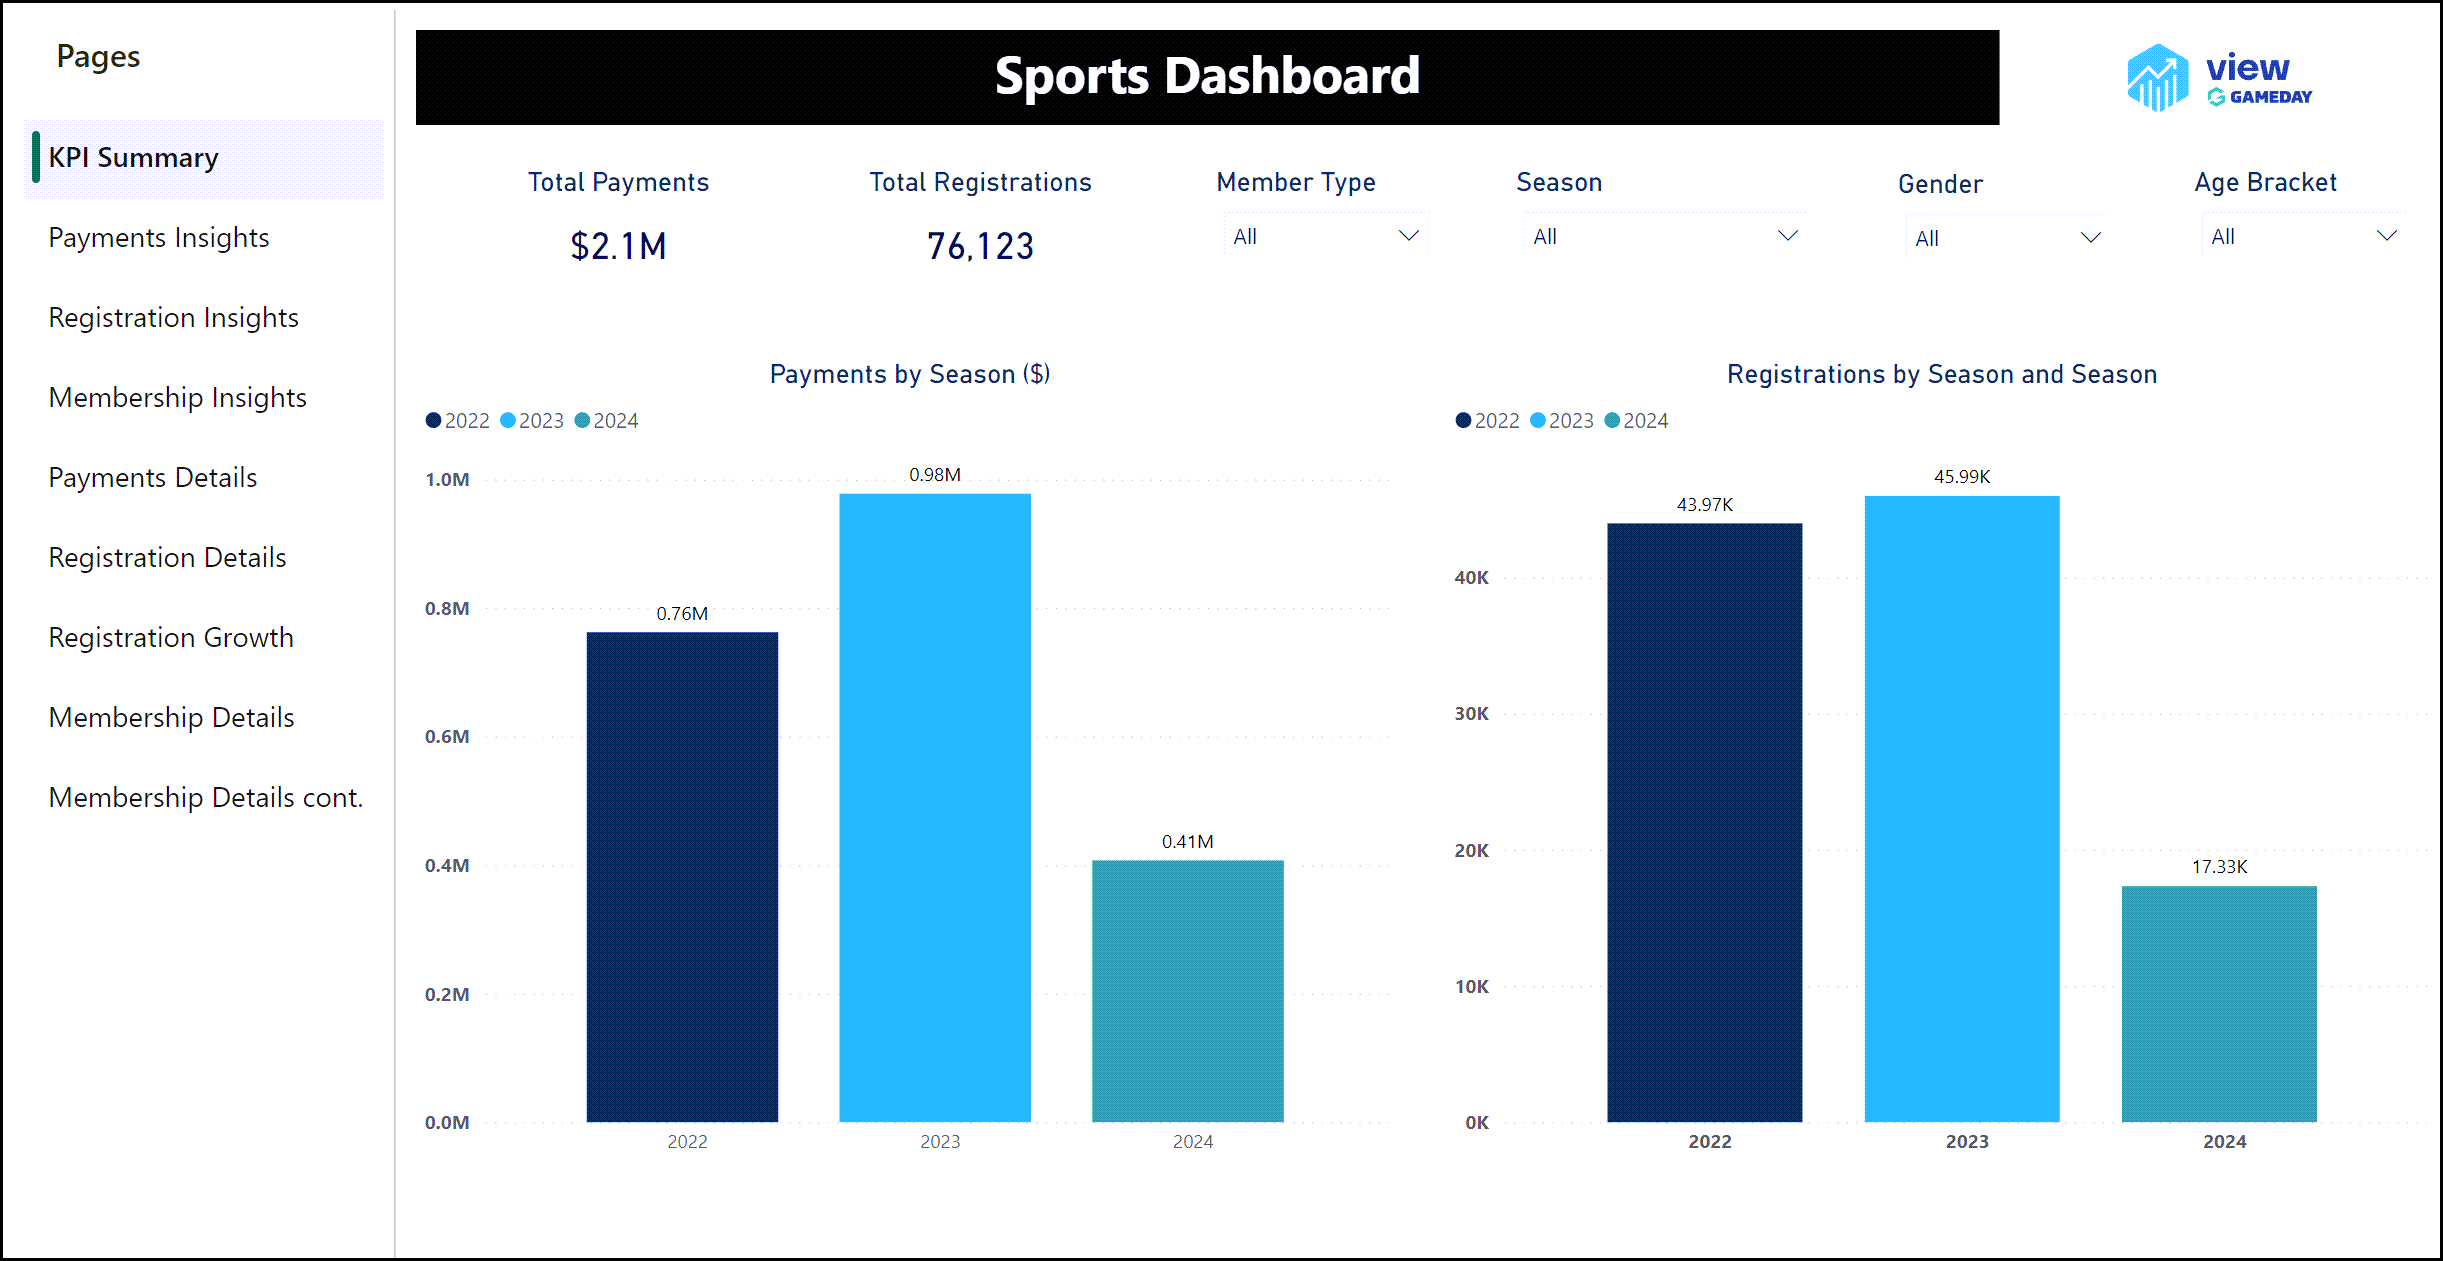
The KPI Insights dashboard gives you an overall summary of key metrics including:
- Total Payments: The total value of payments processed online through your Passport database/hierarchy
- Total Registrations: The total number of registrations completed through your Passport database/hierarchy
- Payments by Season ($): Provides a breakdown of the value of total payments processed online each season
- Registrations by Season: Provides a breakdown of the total number of registrations completed each season
Payment Insights
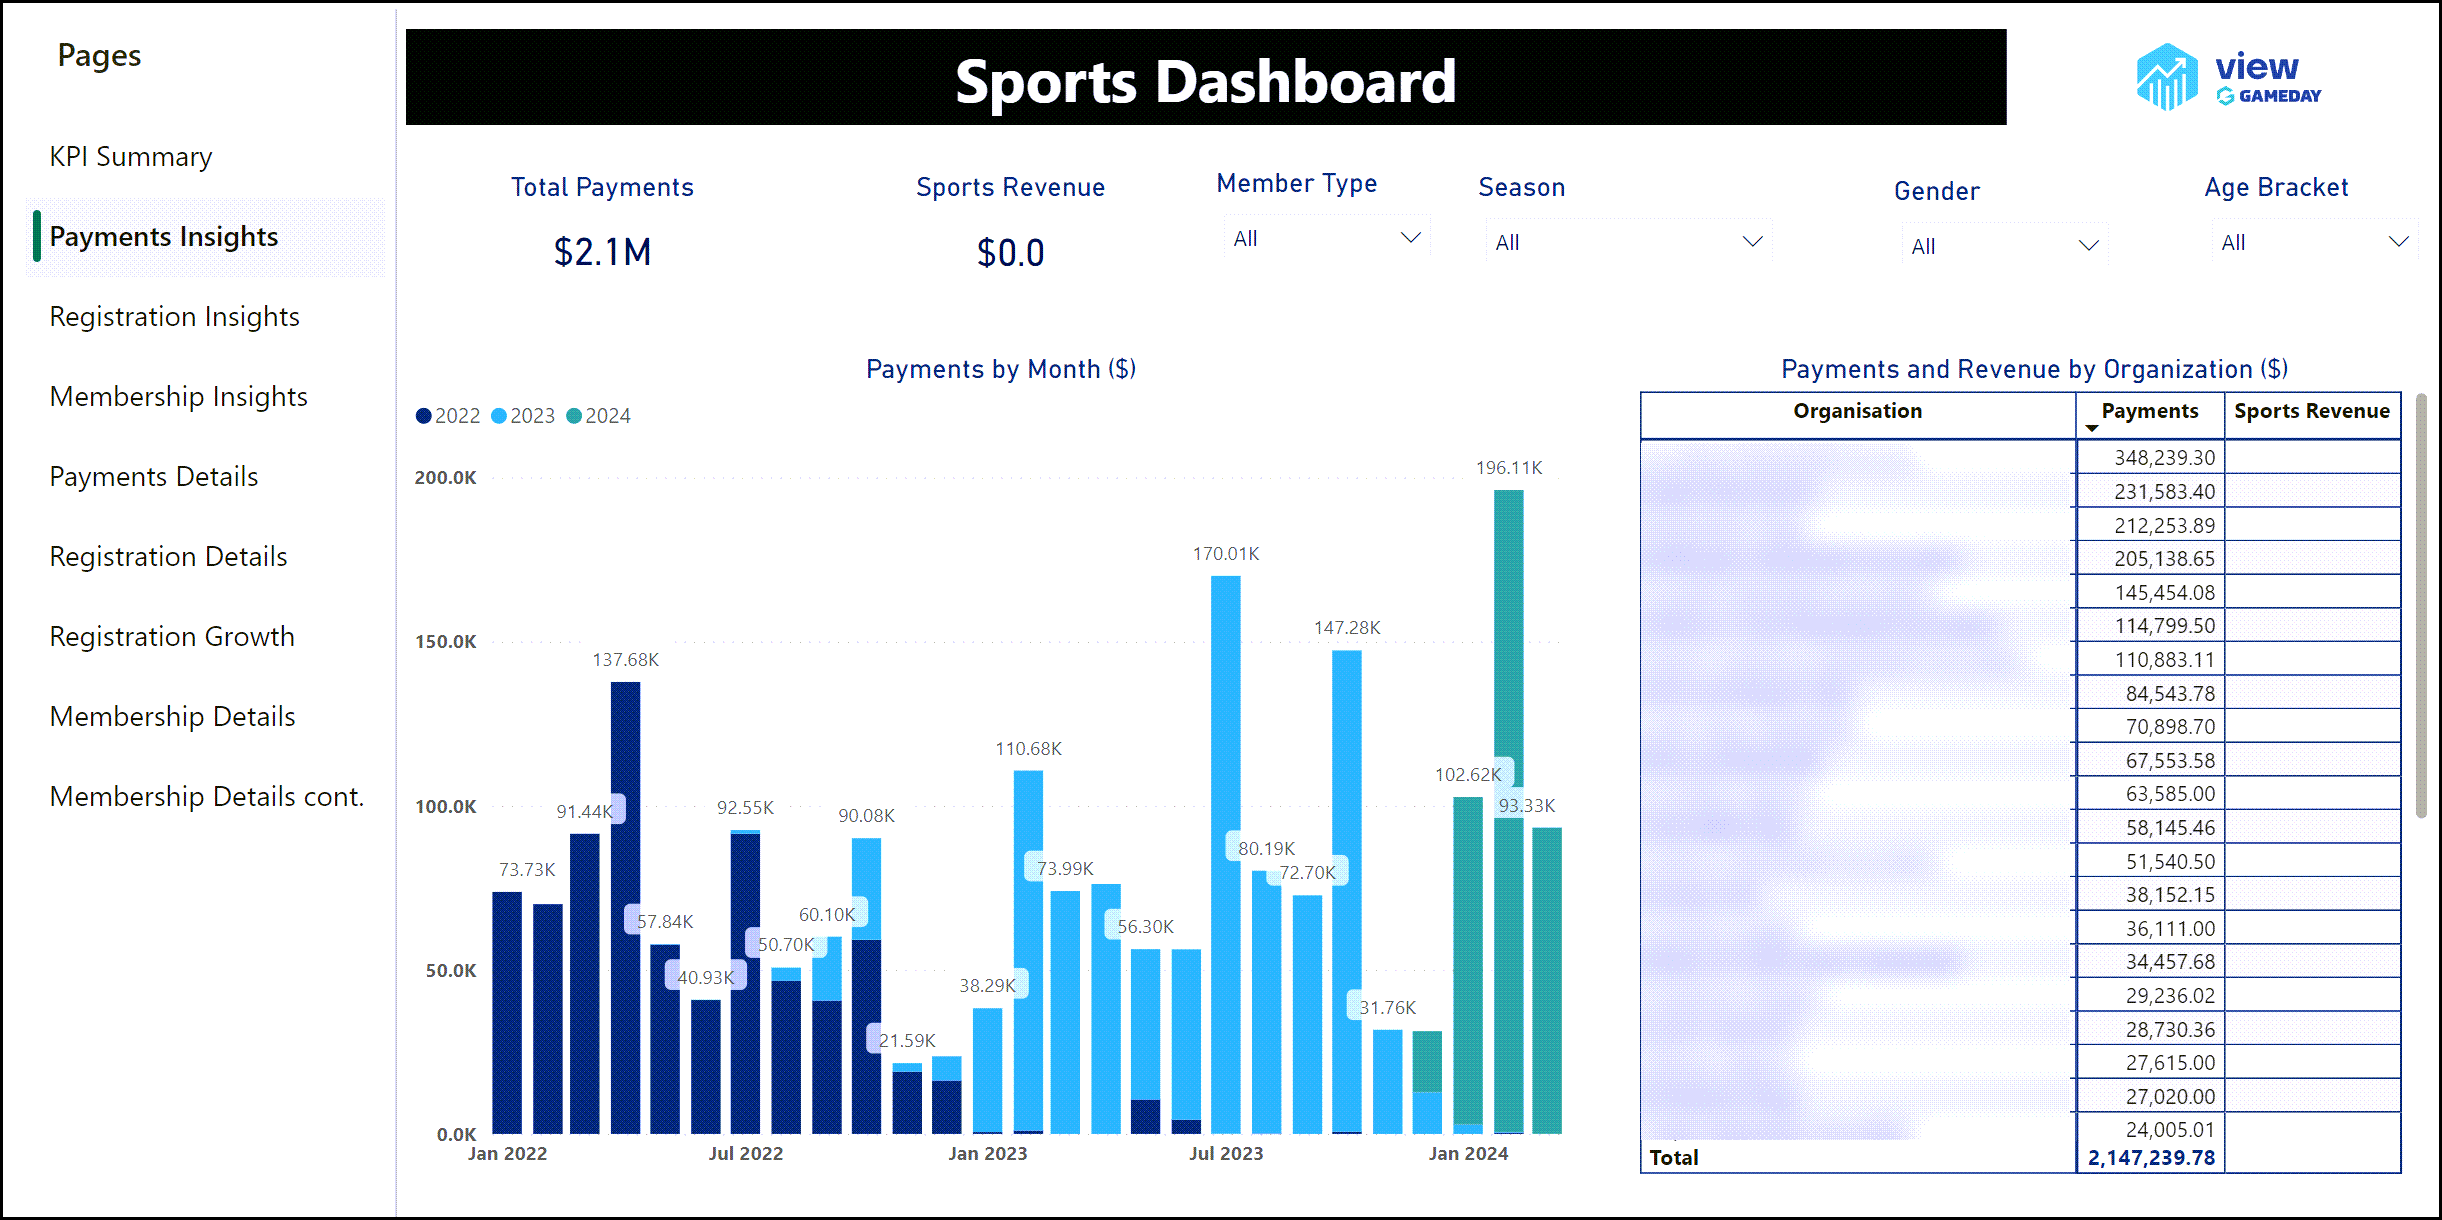
The Payment Insights dashboard displays:
- Total Payments: The total value of payments processed online through your Passport database/hierarchy
- Sports Revenue: The total revenue collected from payments into your individual GameDay database
- Payments by Month: A bar chart representing total payments broken down by month
- Payments and Revenue by Organisation ($): A breakdown of the payments generated by each organisation below you in your hierarchy, including the total payments and the organisation's revenue
Registration Insights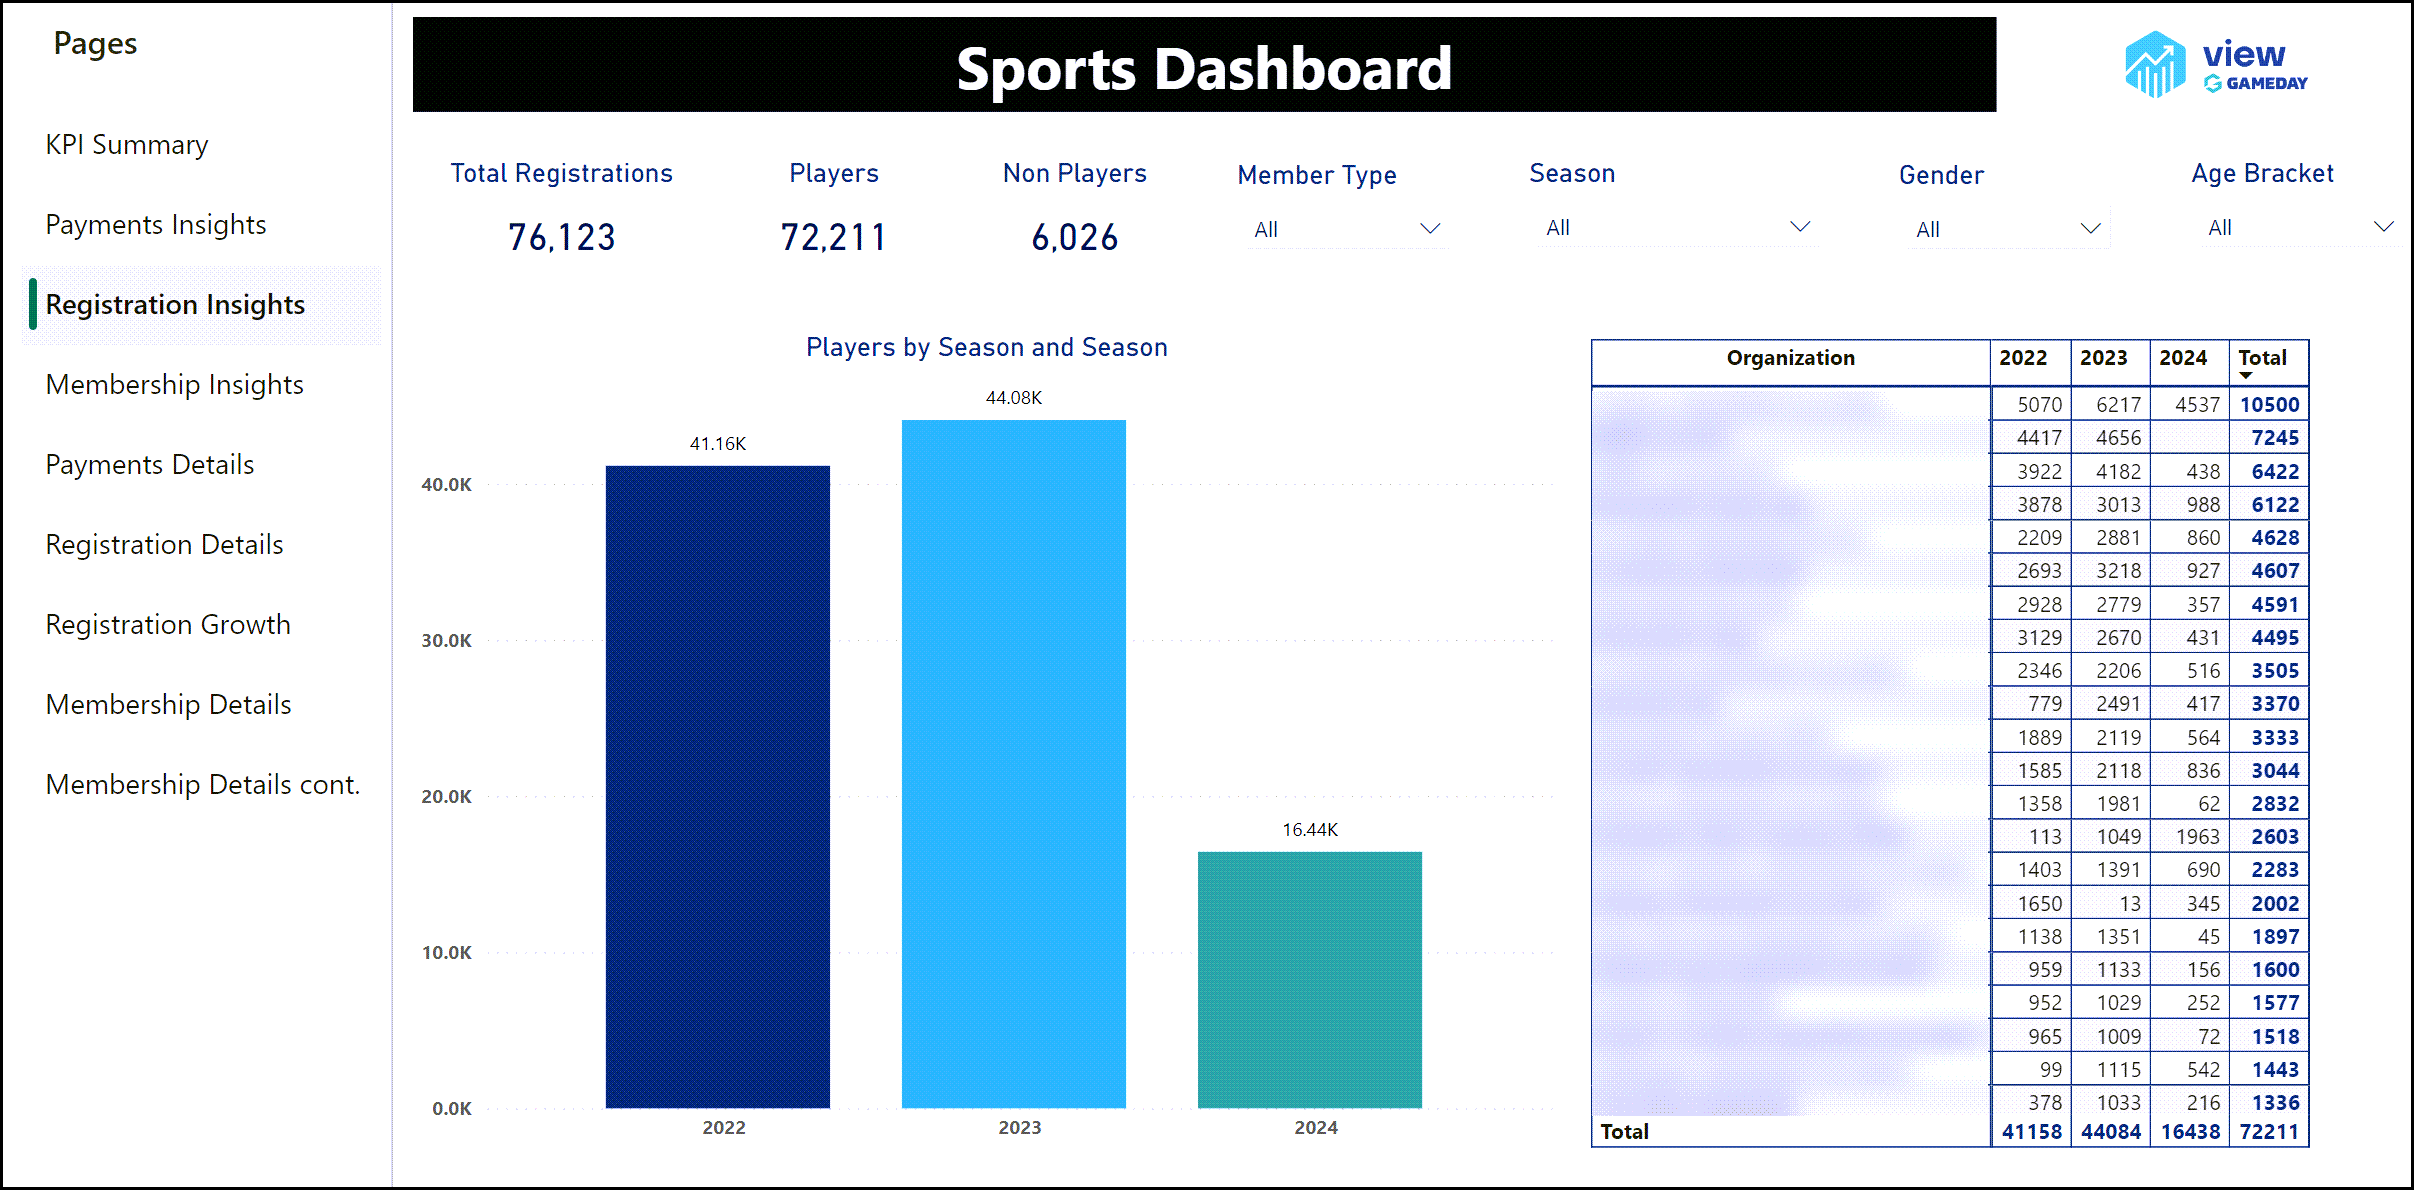

- Total Registrations: The total number of registrations completed through your Passport database/hierarchy
- Players: The total number of members who registered with the 'Player' Member Type
- Non-Players: The total number of members who did not register with the 'Player' Member Type
- Players by Season: Provides a breakdown of the total number of members who registered as a player each season
- Registrations by Organisation: A breakdown of the number of registrations processed by each organisation below you in your hierarchy each season
Membership Insights
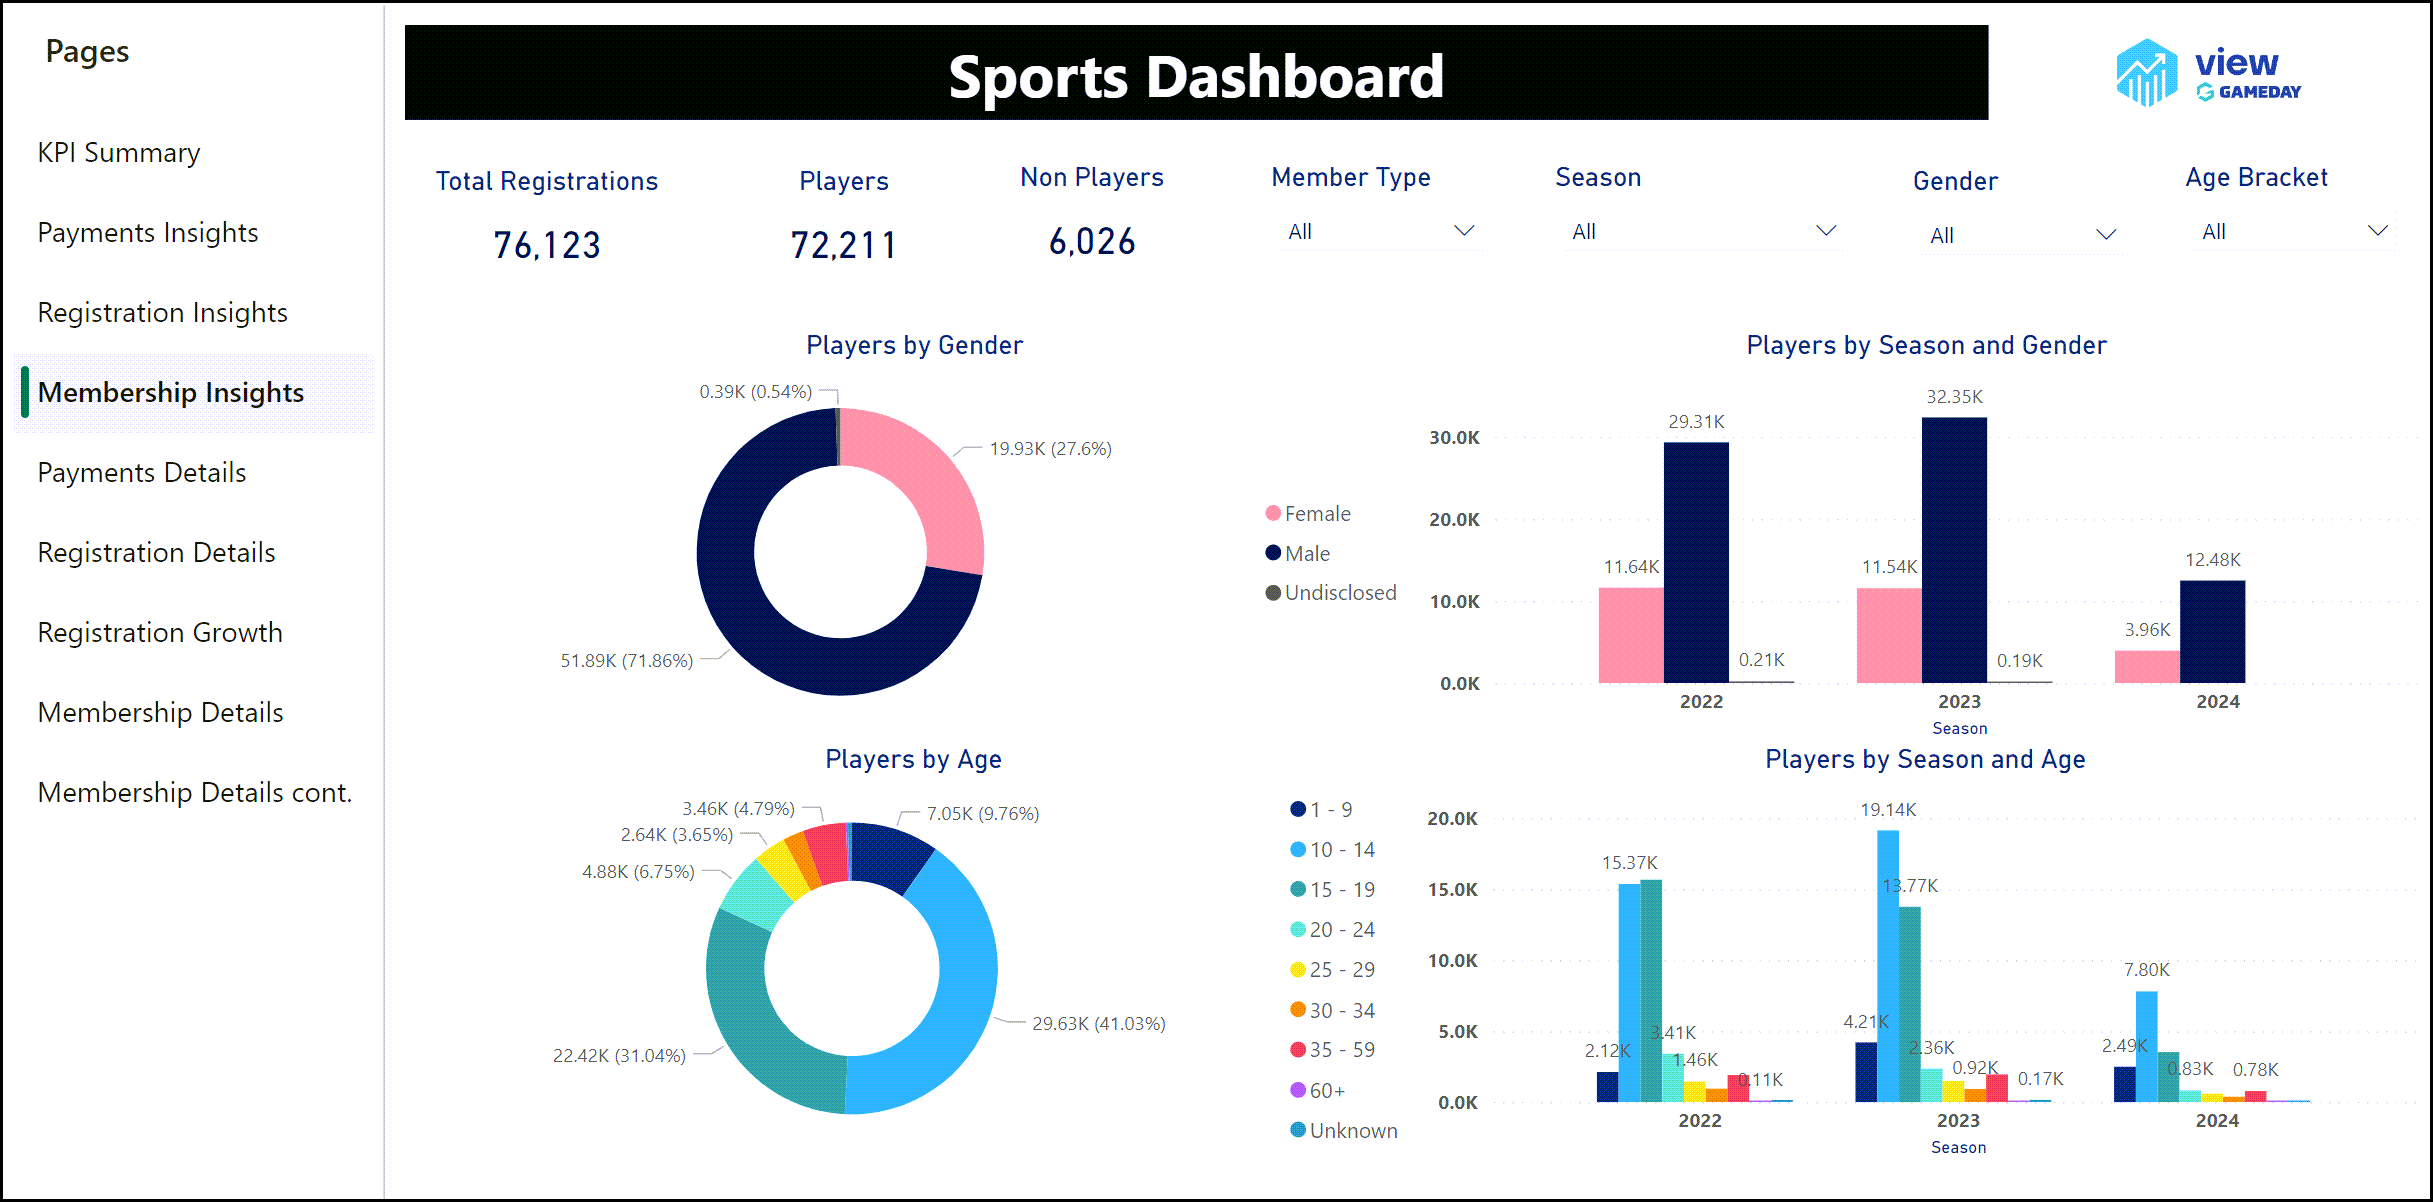
The Membership Insights dashboard displays a series of metrics designed to give you a snapshot of your member characteristics, including:
- Total Registrations: The total number of registrations completed through your Passport database/hierarchy
- Players: The total number of members who registered with the 'Player' Member Type
- Non-Players: The total number of members who did not register with the 'Player' Member Type
- Players by Gender: A pie chart that shows the proportion of your members who are classified as Male, Female or undisclosed gender
- Players by Age: A pie chart that shows the proportion of your members within each age bracket
- Players by Season & Gender: Displays the total number of members who are classified within each gender each season
- Players by Season & Age: Displays the total number of members who are categorised within each age bracket each season
Payment Details
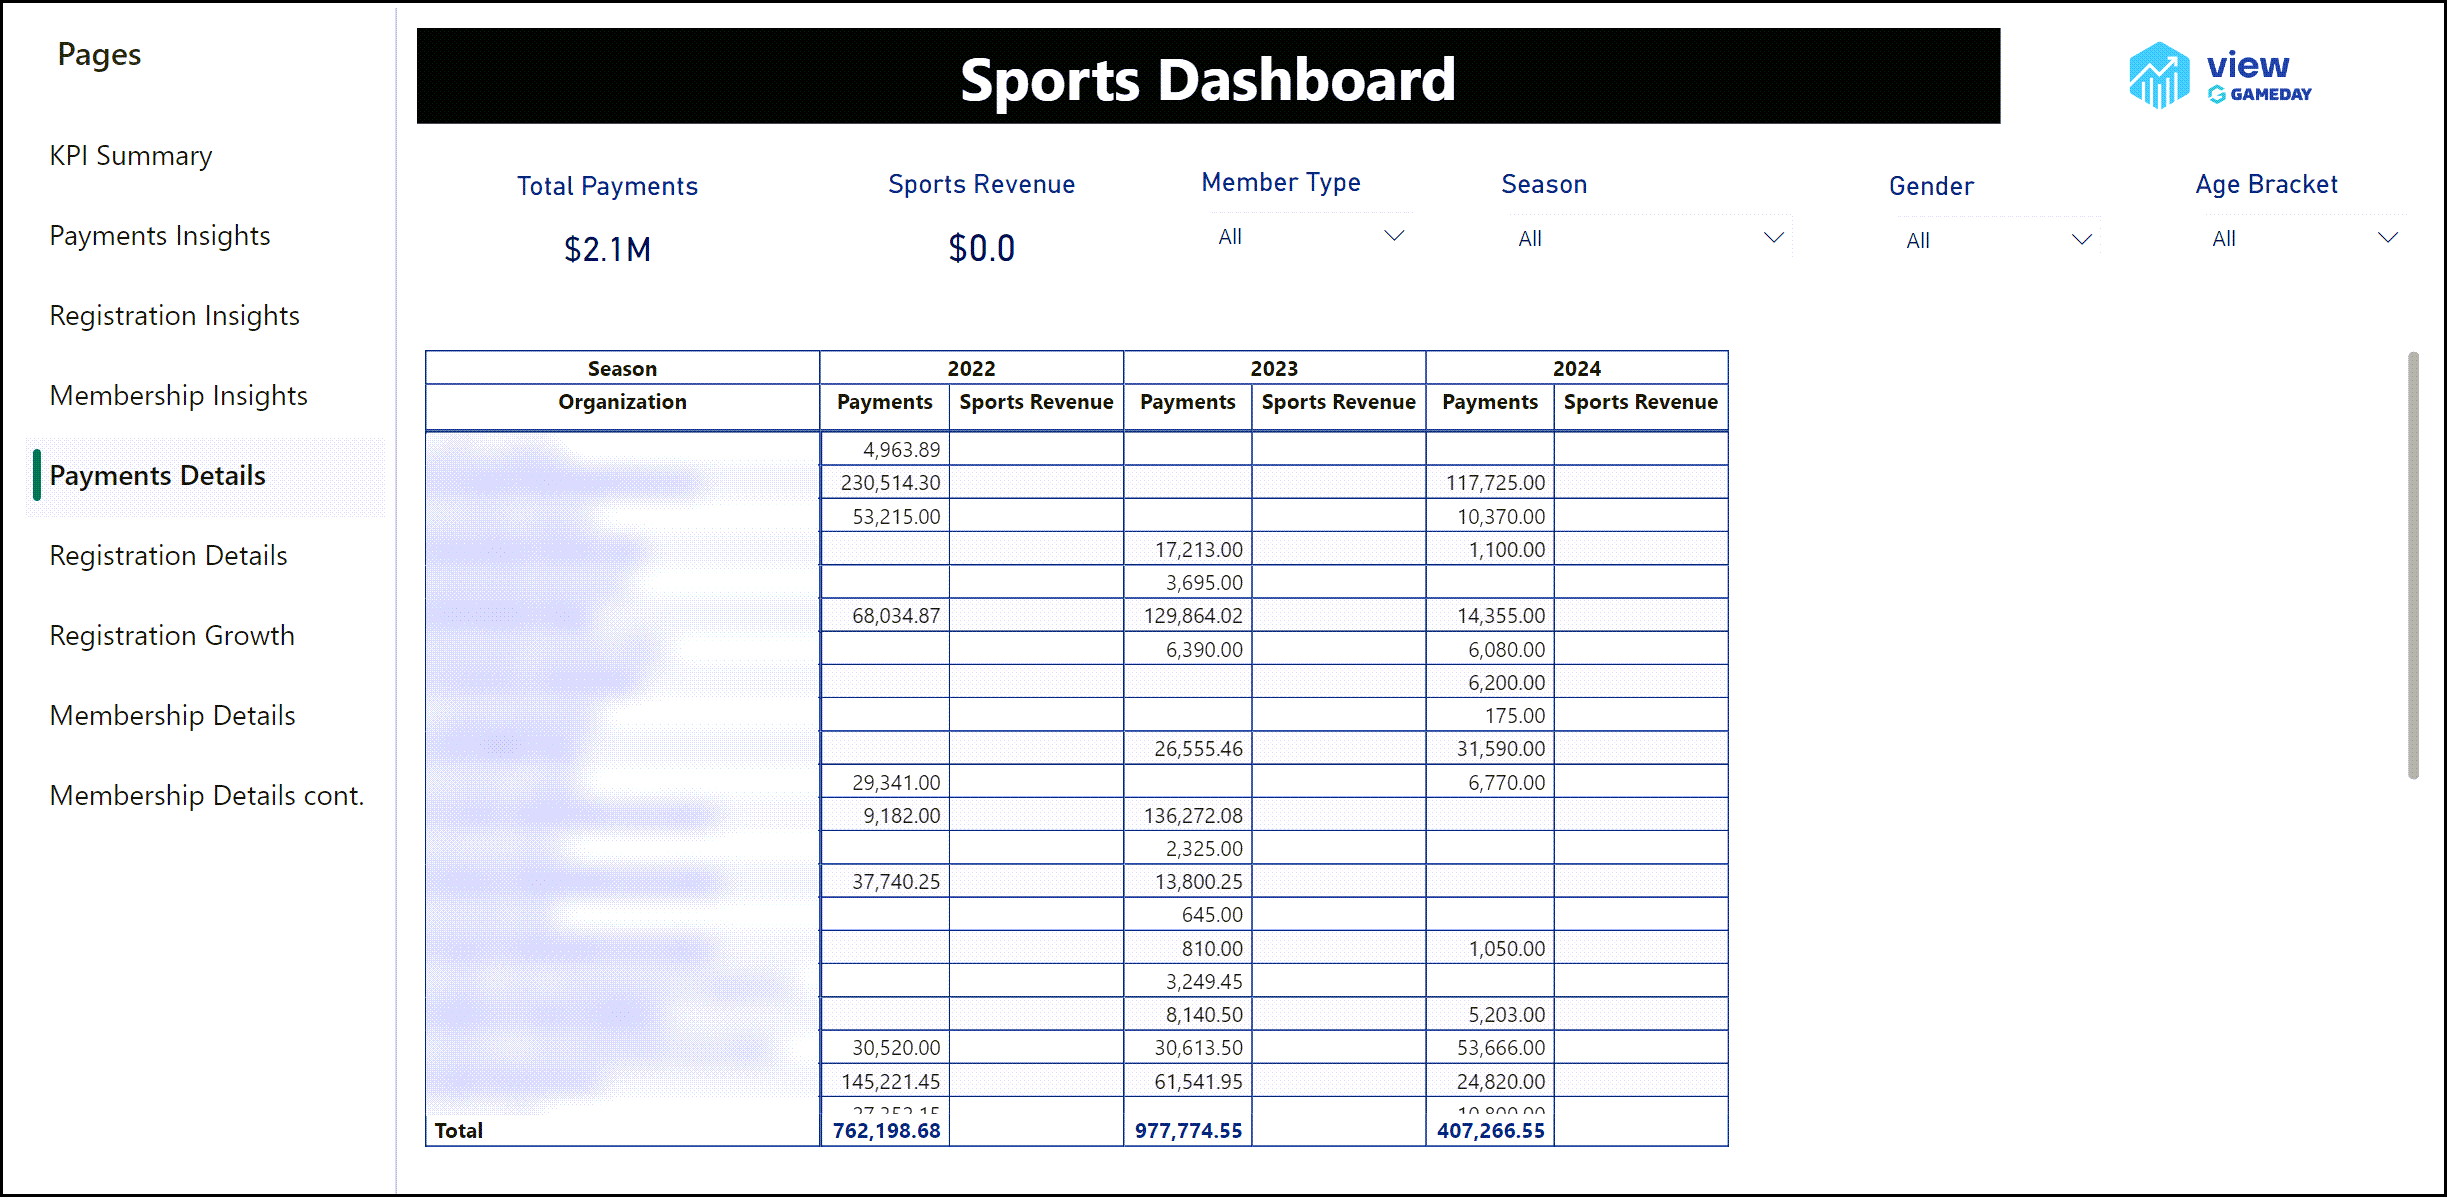
The Payment Details dashboard provides you with a more comprehensive hierarchy breakdown of your payments, including:
- Total Payments: The total value of payments processed online through your Passport database/hierarchy
- Sports Revenue: The total revenue collected from payments into your individual GameDay database
- Payments by Organisation: Displays a tabular report of each organisation within your hierarchy, and their total payments and revenue each season
Registration Details
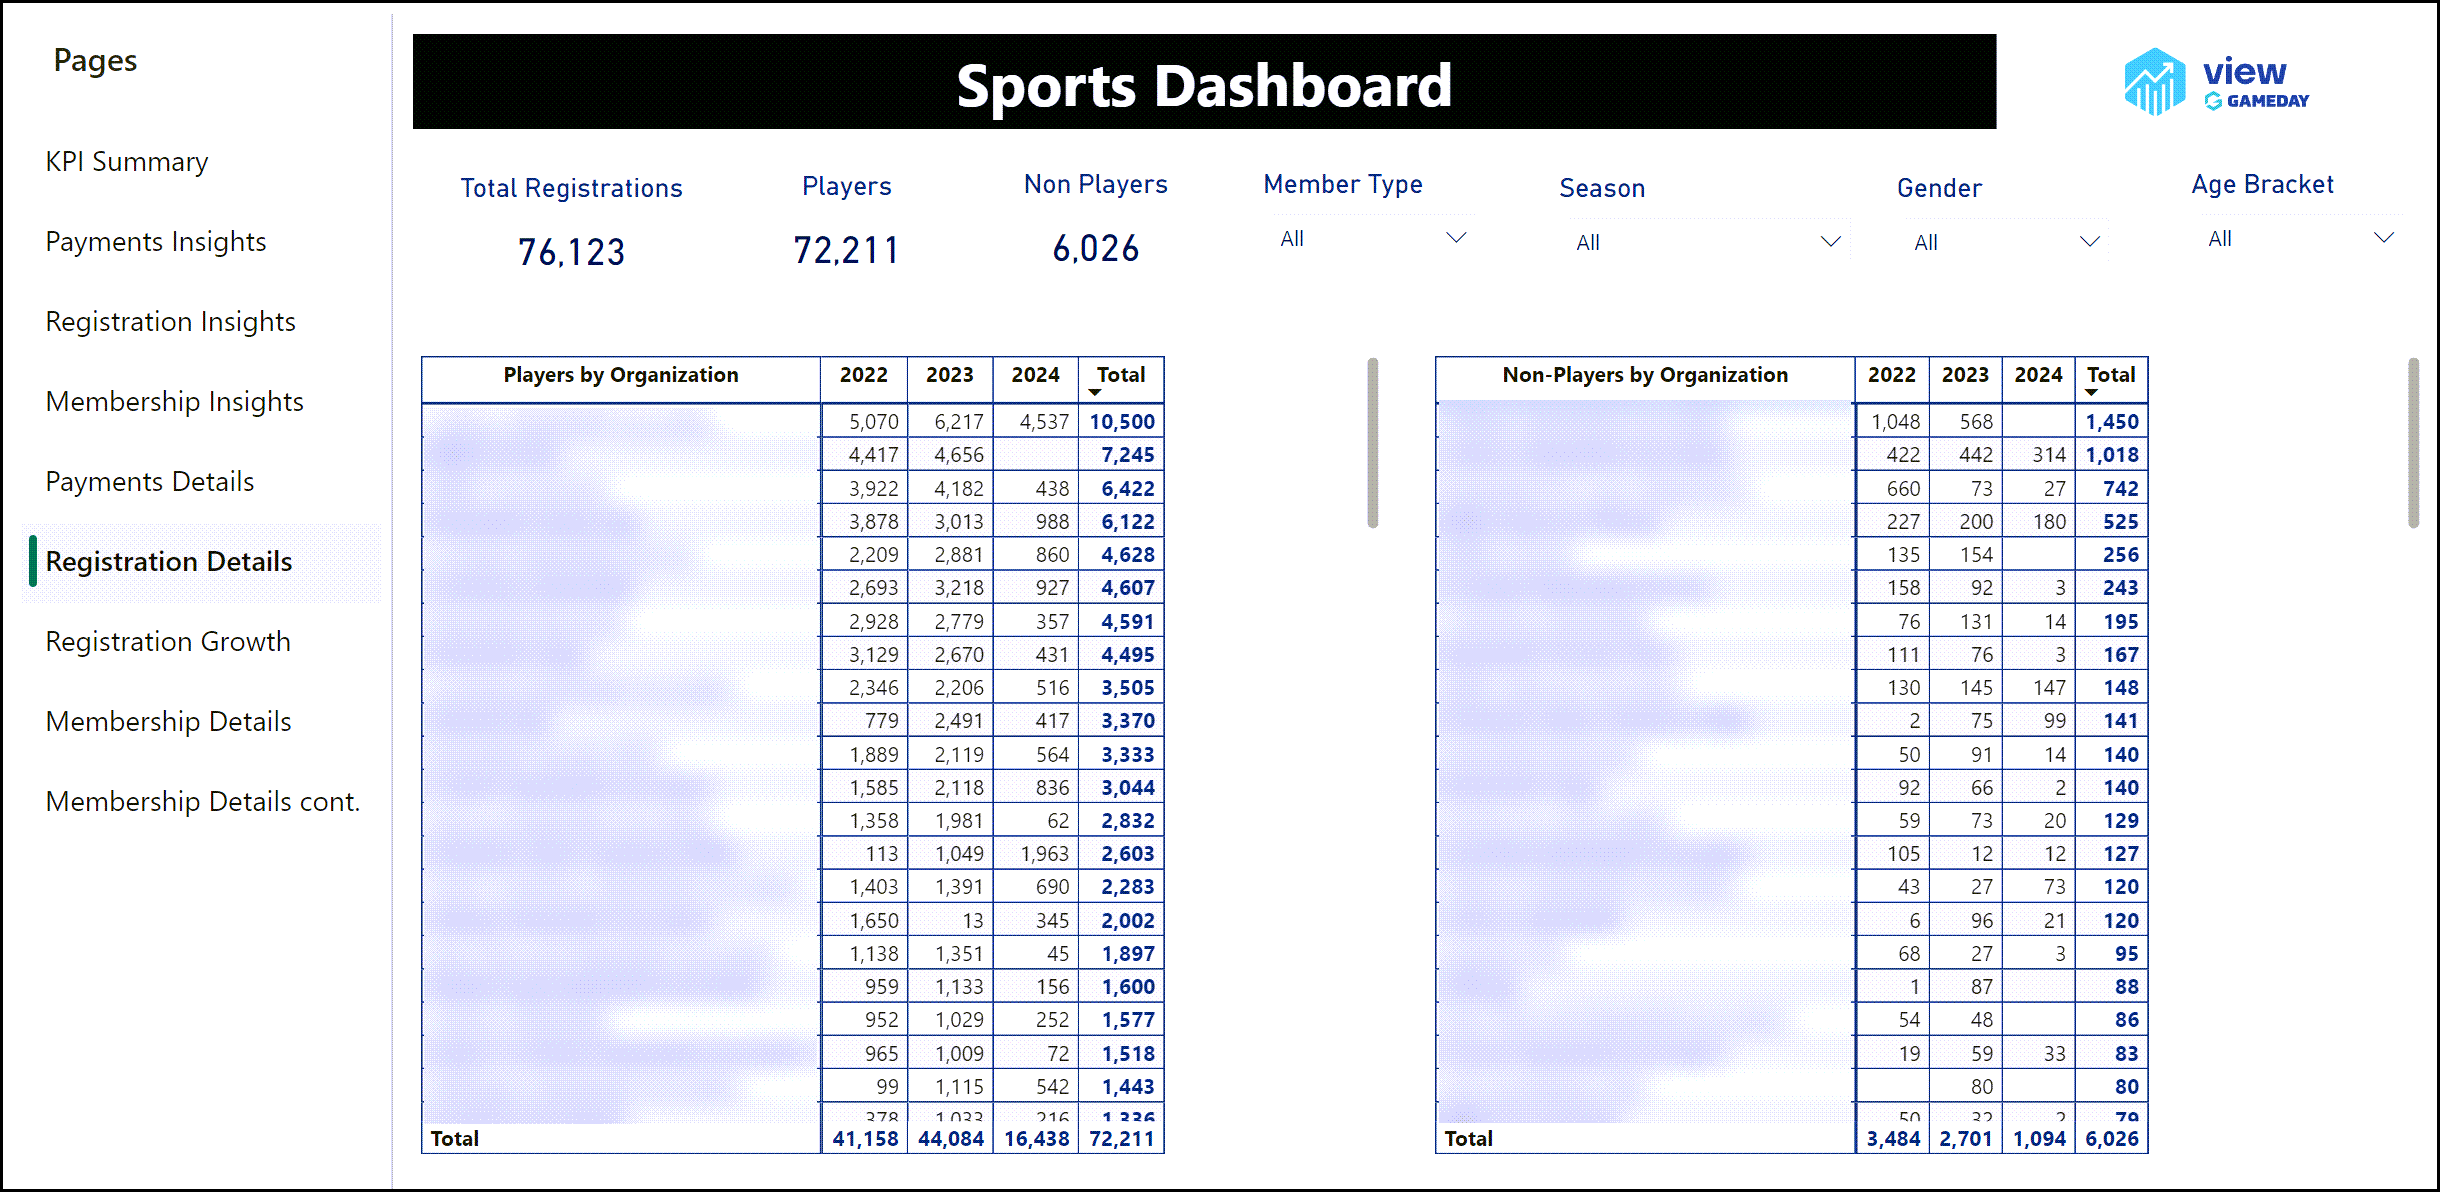
The Registration Details dashboard provides you with a more comprehensive hierarchy breakdown of your registration data, including
- Total Registrations: The total number of registrations completed through your Passport database/hierarchy
- Players: The total number of members who registered with the 'Player' Member Type
- Non-Players: The total number of members who did not register with the 'Player' Member Type
- Players by Organisation: Displays a tabular report of each organisation within your hierarchy, and their total player registrations each season
- Non-Players by Organisation: Displays a tabular report of each organisation within your hierarchy, and their total non-player registrations each season
Registration Growth
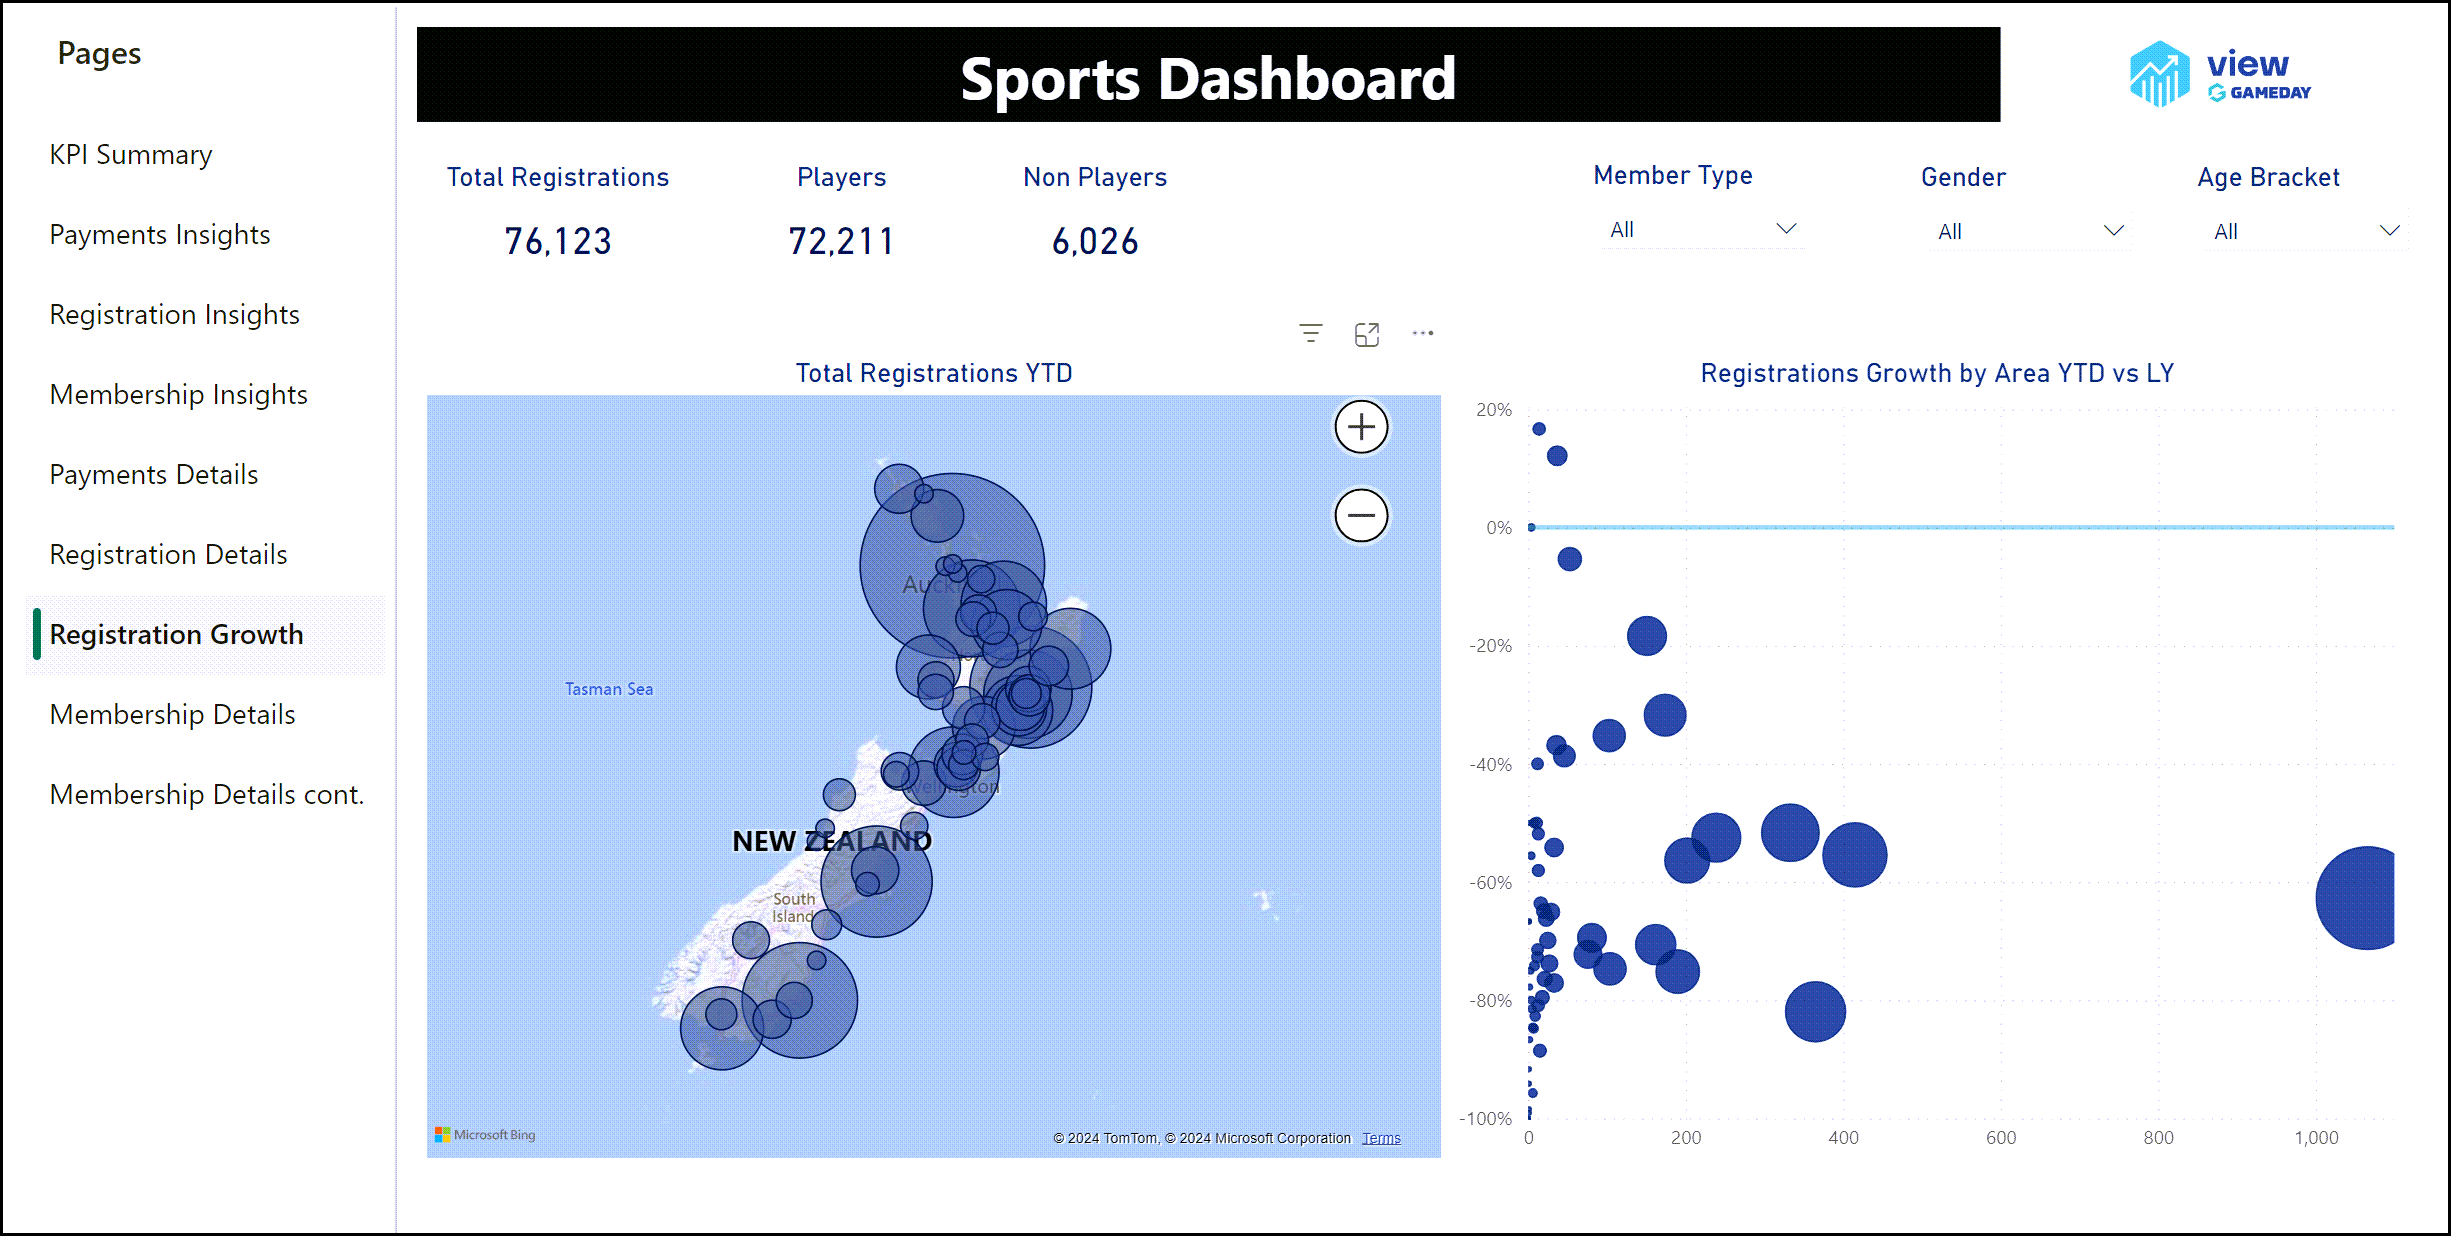
The Registration Growth dashboard allows you to interact with a live map showing your growth areas based on the number of registrations processed from specific locations, including:
- Total Registrations: The total number of registrations completed through your Passport database/hierarchy
- Players: The total number of members who registered with the 'Player' Member Type
- Non-Players: The total number of members who did not register with the 'Player' Member Type
- Total Registrations YTD: Displays an interactive map of the registration volume and growth of different locations. Use the + and - buttons to zoom in and out to further investigate specific areas, and hover over the hotspots to see additional information on each location
- Registrations Growth by Area YTD vs LY: Shows a plot of different locations and their registration growth based on the previous year. Hover over each plot circle to see additional information
Membership Details
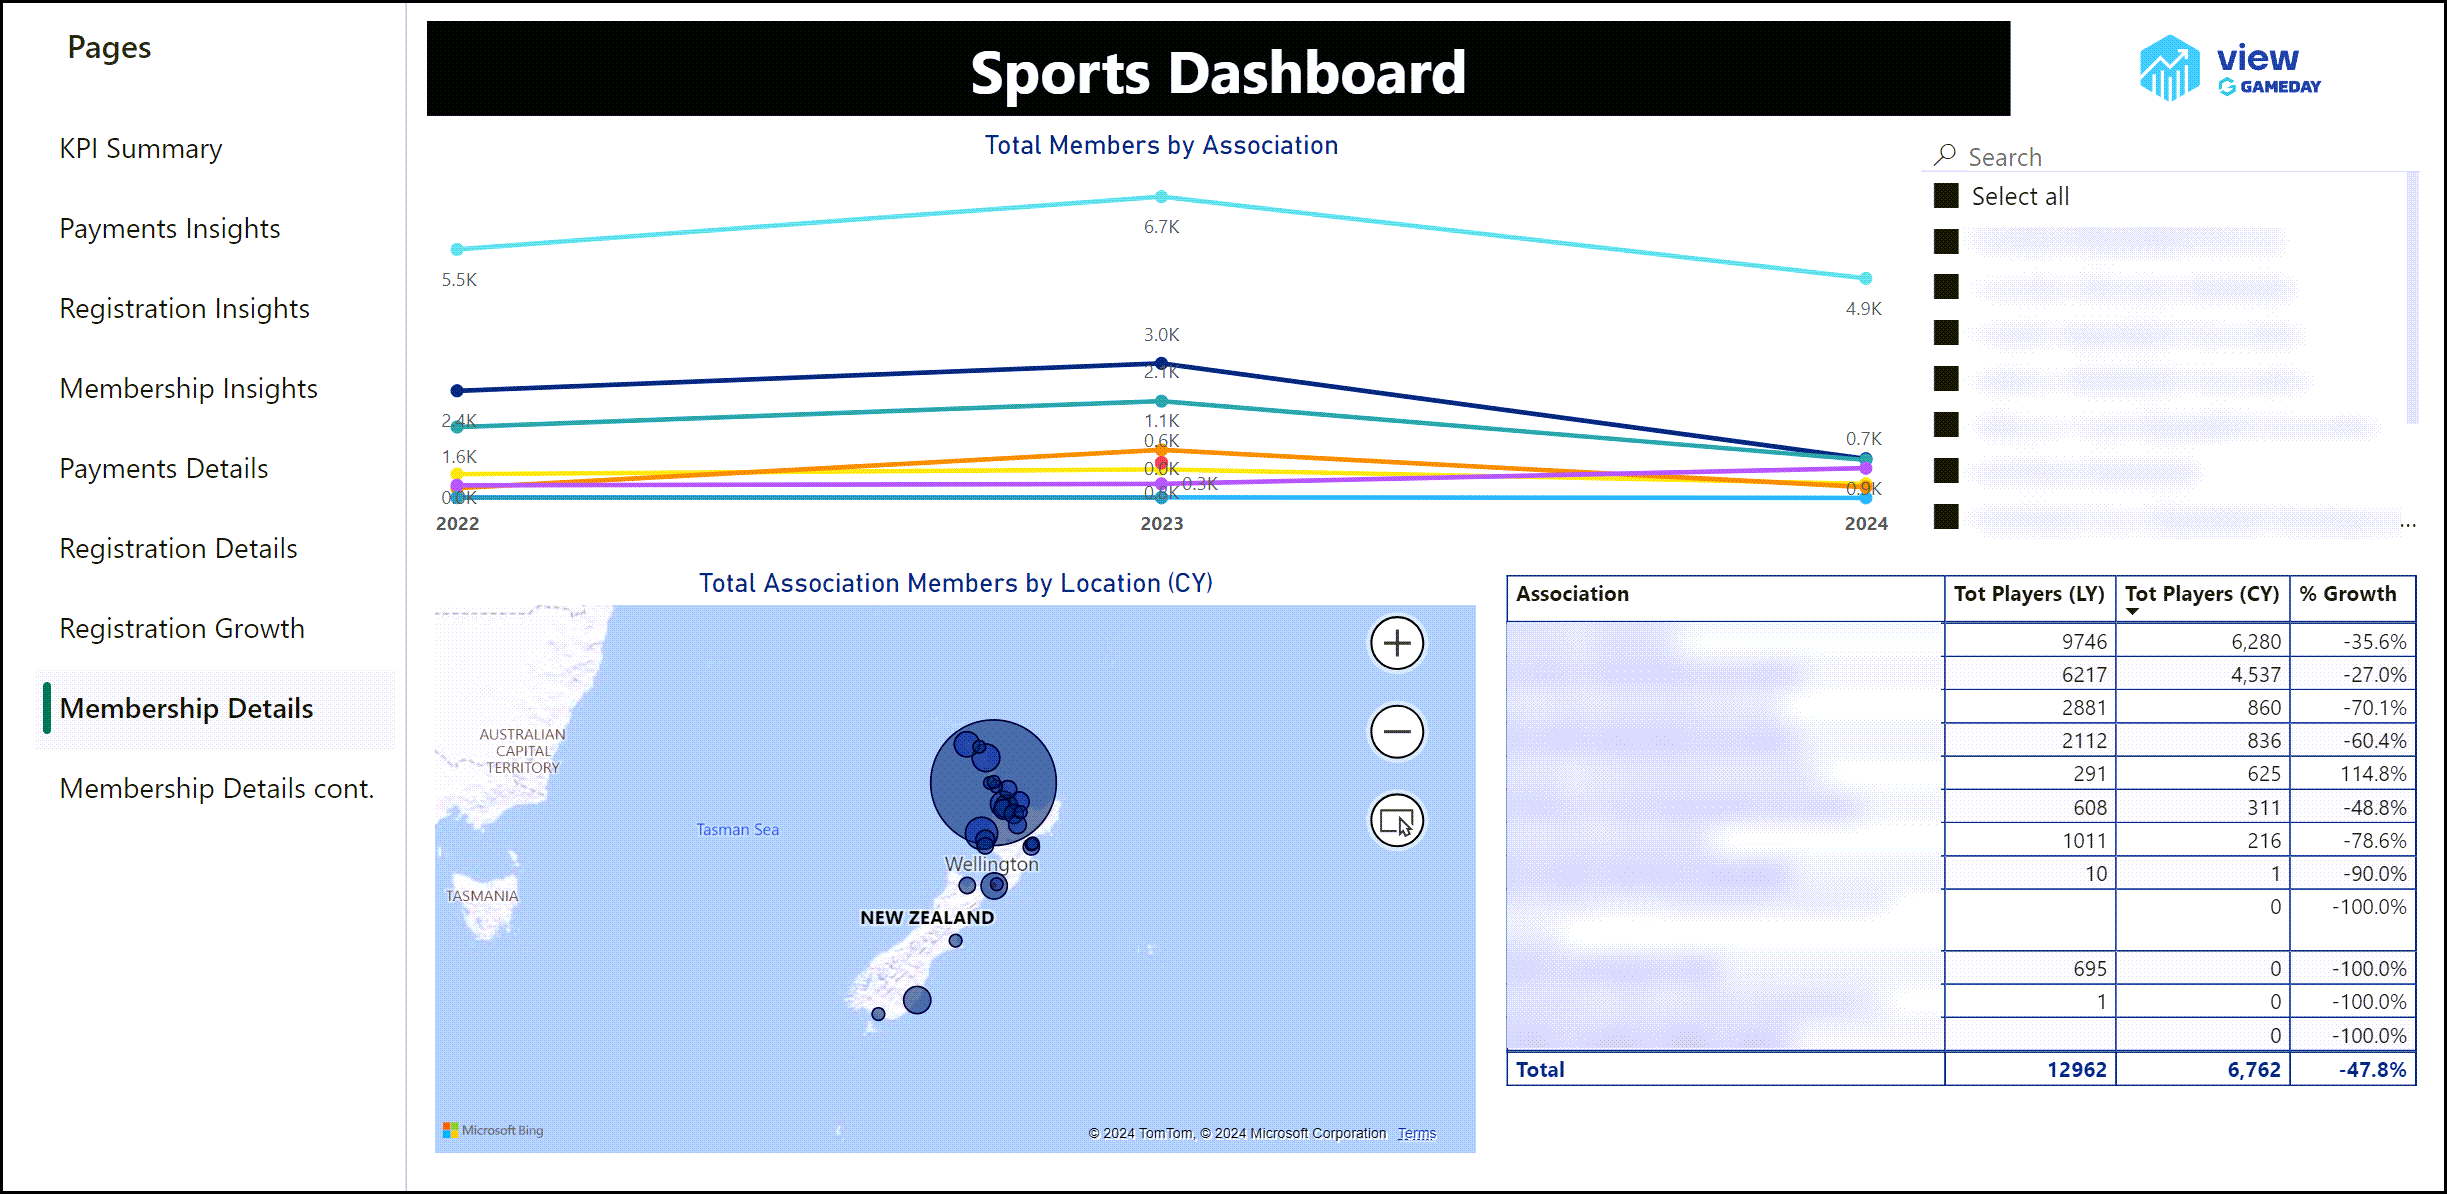
The Membership Details dashboard presents your member data from the point of view of Association-level databases in your Passport hierarchy using the below widgets:
- Total Members by Association: Shows the total number of members registered within each Association per season
- Total Association Members by Location: Allows you to interact with a map showing the common locations in which associations are located
- Association Player/Growth Summary: Breaks down the year-on-year player numbers and growth rate for each Association
Membership Details cont.
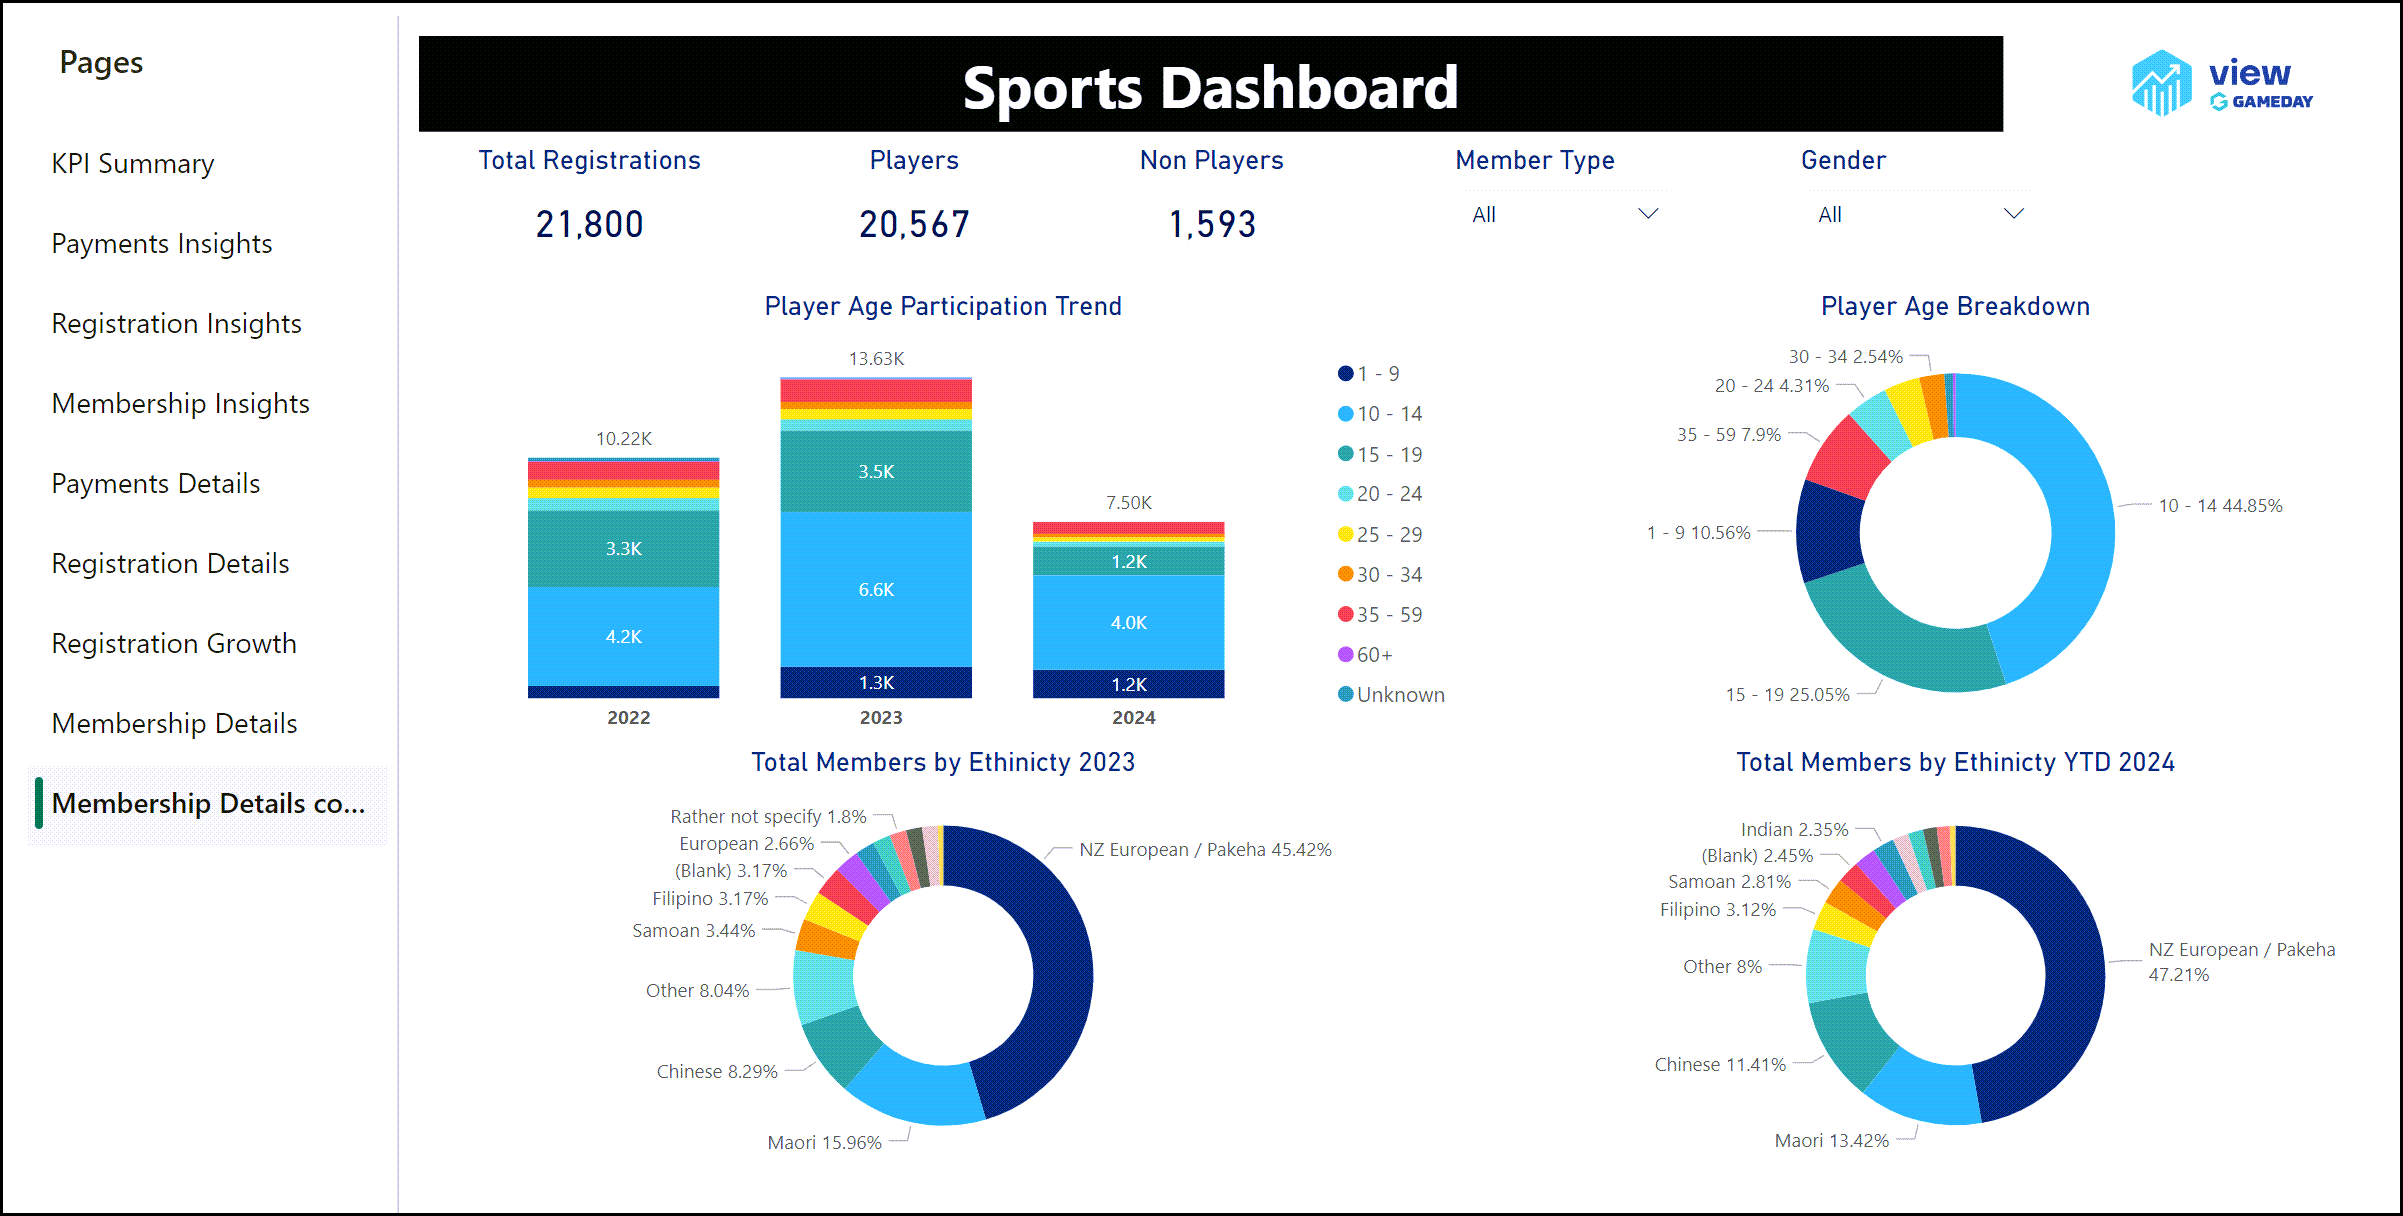
The Membership Details cont dashboard displays more member demographic information, including:
- Total Registrations: The total number of registrations completed through your Passport database/hierarchy
- Players: The total number of members who registered with the 'Player' Member Type
- Non-Players: The total number of members who did not register with the 'Player' Member Type
- Player Age Participation Trend: Displays a breakdown of total players by season and age bracket
- Player Age Breakdown: A pie chart showing the proportion of age brackets that make up your player base
- Total Members by Ethnicity (LY): A pie chart showing the proportion of ethnicities from the previous season
- Total Members by Ethnicity YTD (CY): A pie chart showing the proportion of ethnicities in the current season
